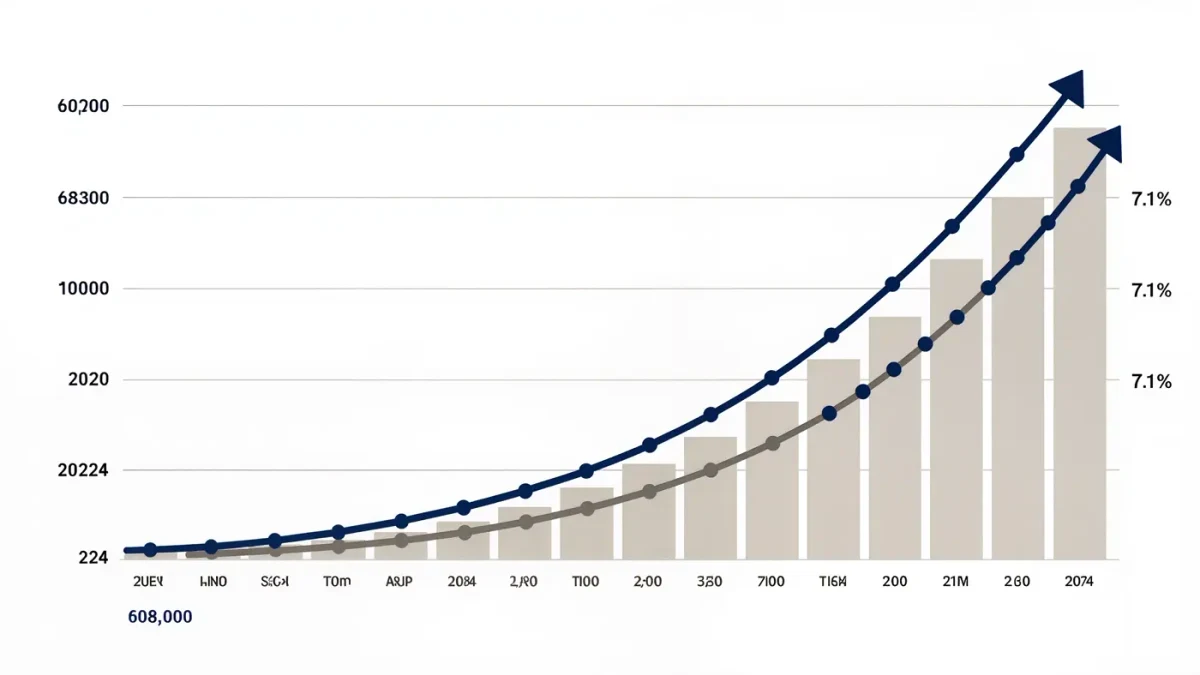
Roughly 608,000 multifamily units were completed in 2024, the highest annual total since 1986, per the Census Bureau's Survey of Construction as tabulated by the National Association of Home Builders in July 2025 — and the national rental vacancy rate, which reached 7.1 percent in Q3 2025 per the Census Bureau's Housing Vacancies and Homeownership Survey, shows what that supply did before rents ever reacted. The lag between delivery and rent softening is the subject of this analysis.
New supply does not hit a market all at once, and it does not hit all submarkets equally. Understanding the absorption lag is the difference between reading a supply pipeline correctly and reacting to rent numbers that describe last year's deliveries.
What Is Absorption in a Rental Market?
Absorption is the rate at which newly delivered rental units are leased. The Census Bureau measures it directly for multifamily buildings through its Survey of Market Absorption, which tracks how many new apartments are rented within three months of completion. A market absorbing 60 percent of new units in three months is tight; a market absorbing below 50 percent is accumulating standing inventory that landlords compete against.
Absorption is demand expressed as a flow. Household formation, job growth, and move-in ability set the ceiling on how many units a metro can digest per quarter, and that ceiling does not move when a tower opens. Supply is lumpy; demand is steady. That mismatch is the absorption lag.
How Long Does the Lag Between Deliveries and Rent Moves Run?
The typical chain runs nine to eighteen months. A building completes, leases at a concession-heavy initial rate, standing vacancy rises, competing buildings match the concessions, and only then do effective rents on new leases fall. Renewal rents follow with another lag, because existing tenants renegotiate on their own schedule, not the market's. The 2024-2025 national data fit the pattern: completions peaked in 2024 at roughly 608,000 units per the NAHB tabulation, and the rental vacancy rate climbed steadily through 2025 to 7.1 percent by the third quarter, per the Census Bureau, while rents grew only modestly.
The lag runs longer when deliveries cluster. A metro receiving five thousand units in four quarters absorbs them faster than the same volume landing in two quarters, because leasing staffs, move-in demand, and price signals all need time to clear. Seasonality compounds this: units completing in the fourth quarter enter a leasing market that slows through the holidays, adding a quarter of delay before the first meaningful absorption data exists.
Why Do Concessions Appear Before Rent Cuts?
Owners prefer concessions to face-rate cuts for one measurable reason: face rates anchor renewals and appraisals. A month of free rent on a twelve-month lease costs about 8.3 percent of annual revenue but leaves the contract rate intact, whereas an 8 percent rate cut propagates into every renewal negotiation and into the income approach an appraiser runs. Concessions are also reversible — an owner can pull them the quarter demand tightens without announcing a price increase.
For a small landlord, the practical consequence is that concession advertising is the earliest visible signal. When comparable listings in a submarket begin advertising weeks of free rent, effective rents have already fallen even if every posted rate is unchanged. Reading posted rates alone in a heavy-supply market measures the sticker, not the transaction.
Which Markets Absorb Heavy Supply Fastest?
Absorption speed tracks three measurable variables. Job growth, because employed households form and split into separate rentals. Occupancy costs, because units priced near the local rent-to-income ceiling lease slower regardless of demand. And location within the metro, because deliveries clustered in one submarket compete mostly with each other, while the same units spread across a metro thin the competition.
The 2024 supply wave concentrated in Sun Belt metros, which is why national vacancy figures blend tightening coastal markets with loosening Southern ones. A national 7.1 percent vacancy rate in Q3 2025, per the Census Bureau, coexisted with metros where asking rents were flat or falling and others where rents kept rising — the same release reports regional detail for exactly this reason.
How Should an Investor Underwrite a High-Delivery Market?
The disciplined move is to underwrite against the pipeline, not the current rent. A purchase analysis in a market with two years of heavy deliveries ahead assumes rent growth at or below zero until the pipeline clears, and treats current rents as the ceiling rather than the floor. An illustration using a hypothetical $1,800 unit: at a 608,000-unit national delivery backdrop, assuming zero rent growth for two lease cycles versus three percent annual growth changes cumulative revenue by roughly $2,200 per unit over the window — more than most acquisition fee differences.
The reverse underwriting applies in metros where completions have already fallen. Census completions data showed multifamily starts declining from their 2022-2023 peak, which mechanically implies thinner deliveries from late 2026 onward, per the same construction series. Markets can tighten with a similar lag, which cuts both ways for anyone buying on today's rent roll.
What Should Readers Watch Next?
Watch the Census Bureau's quarterly Survey of Market Absorption release for the absorbed-within-three-months share; watch the Housing Vacancies series for whether the national rate holds above 7 percent; and watch local concession language in comparable listings, the fastest-moving of the three signals. The data describes aggregate flows; it says nothing about any single property's pricing power, and none of it is a forecast.