Diversifying a rental portfolio across metros spreads the risks that a single submarket concentrates: one local employer, one rent control ordinance, one vacancy cycle. But diversification also imports a cost stack that differs market by market, and in recent years no line in that stack has moved faster than insurance. Where a property sits relative to wind, wildfire, and flood exposure now changes its yield more visibly than most rent trends do.
Climate and insurance claims below are attributed and dated; no market is recommended or discouraged.
What Does Cross-Market Diversification Actually Spread?
It spreads location-specific risk: employment shocks, local regulatory change, oversupply from one construction wave, and tenant-demand cycles that differ by region. Census Bureau population estimates through 2023 and 2024 documented continued net domestic migration toward Southern states, per Census as of 2024 — the flows that pulled investors Sun Belt-ward — and the same wave of migration coincided with the heaviest national apartment deliveries in roughly five decades, per Census Bureau completions data as of 2024. Migration and supply are the two halves of every market bet; diversification across metros means not betting both halves in one place.
What diversification does not spread is system-wide risk: interest rates, national recessions, and federal tax changes touch every metro at once. Cross-market structure narrows idiosyncratic risk, not systematic risk, and the distinction keeps expectations honest.
How Has Insurance Repriced Climate Risk?
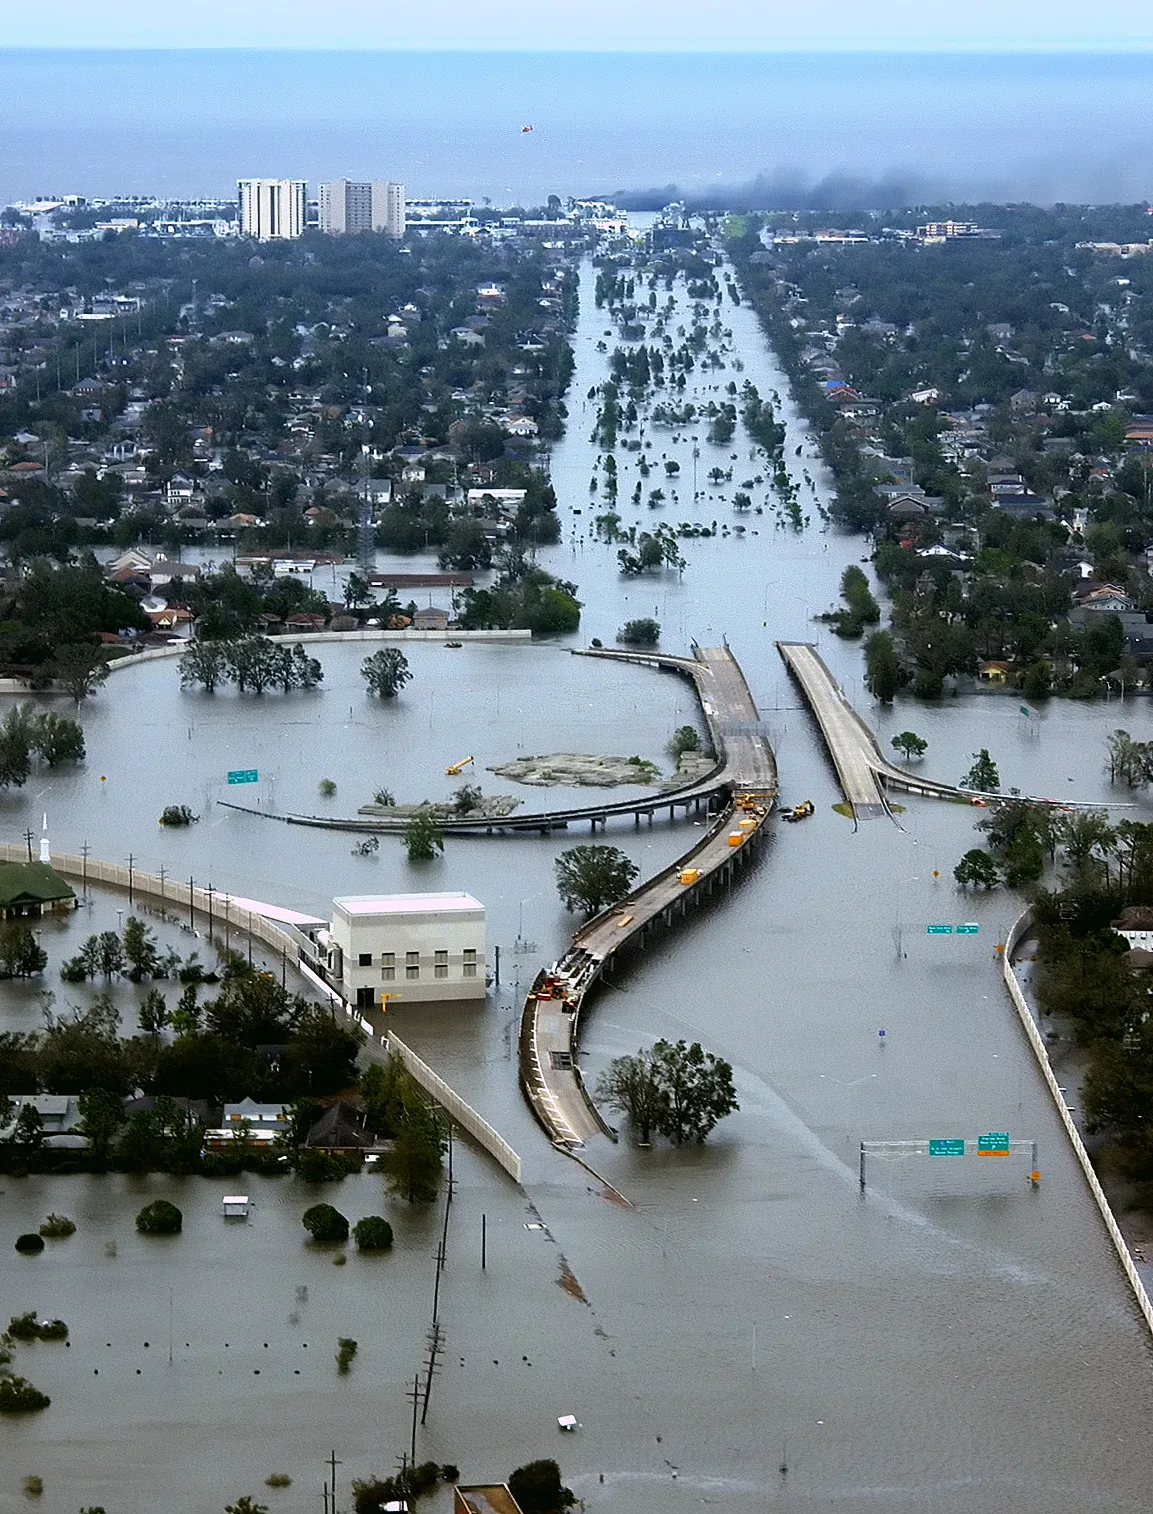
Insurers price expected losses, and their loss experience has worsened in hazard-exposed regions. The national pattern is documented: NOAA's billion-dollar disaster series shows disaster costs rising over the past decade, with 2023 recording one of the highest counts on record, per NOAA as of 2024. Carriers have responded by raising premiums, restricting coverage, and in some high-wildfire and hurricane states withdrawing from the market entirely — major insurers announced pullbacks from California and Florida between 2023 and 2024, per state insurance regulator filings as of 2024.
The consequence for landlords is a market where the insurance line is no longer stable enough to carry forward from a seller's history. Premiums in the highest-cost coastal and wildfire markets have risen by double-digit cumulative percentages since 2020, per industry and state regulator data as of 2024-2025, and some properties now depend on state-backed insurers of last resort whose pricing and coverage terms change by legislative decision rather than market quotation.
What Does an Insurance Quote Do to the Cap Rate?
Insurance is a direct deduction from net operating income, so a premium change moves the cap rate one-for-one with its size. An illustration on round numbers: a $250,000 rental grossing $24,000 in annual rent with $6,000 in taxes and other operating costs shows roughly $18,000 of net operating income — a 7.2 percent cap rate — if insurance costs $1,200. The same property quoted at $4,800, a level now reported in parts of Florida and coastal Louisiana, shows a 5.8 percent cap rate with nothing else changed. The premium gap is the yield gap.
Because the next buyer's lender will require the same coverage, a persistently high insurance market reprices the asset itself, not just the current owner's cash flow. Insurance, like property tax, capitalizes into value.
How Should Climate Exposure Enter Underwriting?
Climate exposure enters underwriting as data, not adjectives. The public inputs are: FEMA's flood maps, which define special flood hazard areas where lender-required flood insurance applies, per FEMA map definitions as of 2025; wildfire hazard severity maps published by several states; wind zone and hurricane history; and the insurance quotation itself, which is the market's consolidated opinion of all of them. Each input is free; together they describe a property's hazard profile before an offer prices it.
The quotation deserves care in its wording: replacement cost, deductibles per peril — wind and hail deductibles in hurricane states are commonly a percentage of insured value rather than a flat dollar amount — and loss-of-rent coverage, which is the clause that determines whether a disaster pauses the mortgage or stops it. A percentage wind deductible on a coastal property converts a routine roof claim into an owner-funded repair, and that difference lives in the policy's terms rather than in its headline premium.
Where Does Regulation Compound the Climate Math?
Regulation interacts with insurance costs at the state level. Some states cap premium increases, which can slow repricing but can also shrink carrier participation and push properties toward residual market mechanisms; others allow market pricing, which passes hazard costs through immediately. Landlord-tenant and rent regulation rules add a second layer — jurisdictions that cap rents while hazard costs rise squeeze the owner's margin from both directions, and both rules are set locally, so they must be read per metro rather than nationally.
The disciplined cross-market comparison therefore stacks four items per metro: verified rent levels against local incomes, the post-sale property tax estimate, an actual insurance quotation with peril terms, and the regulatory framework for rents and evictions. Any two markets with identical price-to-rent ratios can carry materially different net returns once the stack is complete.
What Does Diversification Cost and What Does It Return?
The cost is operational: distance makes self-management impractical, so a diversified portfolio typically pays full property-management fees in every market — commonly 8 to 12 percent of collected rent, per prevailing management contracts as of 2024-2025 — plus the coordination cost of multiple markets' vendors, tax calendars, and legal regimes. Concentrated local owners trade that overhead for their own hours and one market's full risk.
The return on that cost is resilience: a vacancy shock, a regulatory change, or an insurance repricing in one metro becomes a fraction of portfolio income rather than all of it — provided the diversification is real. Two Sun Belt metros exposed to the same wind regime and the same supply wave diversify less than their distances suggest; a hazard map and a permit pipeline reveal the overlap that a map of the United States hides.
The summary for a small investor: diversify deliberately, price insurance as a first-class line rather than a closing formality, and let hazard data — FEMA maps, state wildfire maps, carrier quotations — carry the same weight in market selection that rent comps carry in property selection.
How Do You Build a Climate-Aware Market Screen?
A climate-aware screen is a stack of free lookups, not a consultant product. The first layer is hazard: FEMA flood maps for riverine and coastal flood exposure, state wildfire hazard maps where published, and wind zone designations for hurricane regions. The second layer is insurance market structure: whether the state has a healthy private market or significant dependence on a residual mechanism, and how rate filings have trended, per state regulator records as of 2025. The third layer is the quotation itself on an actual target property, with peril deductibles read, not skipped.
What the screen produces is a ranking of markets by how much of the gross rent the insurance line consumes — a ratio that can be checked annually, because it moves. A market whose insurance-to-rent ratio doubles in three years has changed its investment profile regardless of what its rent growth did, and lenders' coverage requirements respond to the same movement.
The screen is also the antidote to the two lazy extremes: ignoring hazard entirely, or writing off every coastal and wildfire state as uninvestable. The data supports neither; it supports gradients, and gradients are what underwriting is for. Properties in hazard regions can still meet return requirements when the insurance terms are priced honestly from the start.