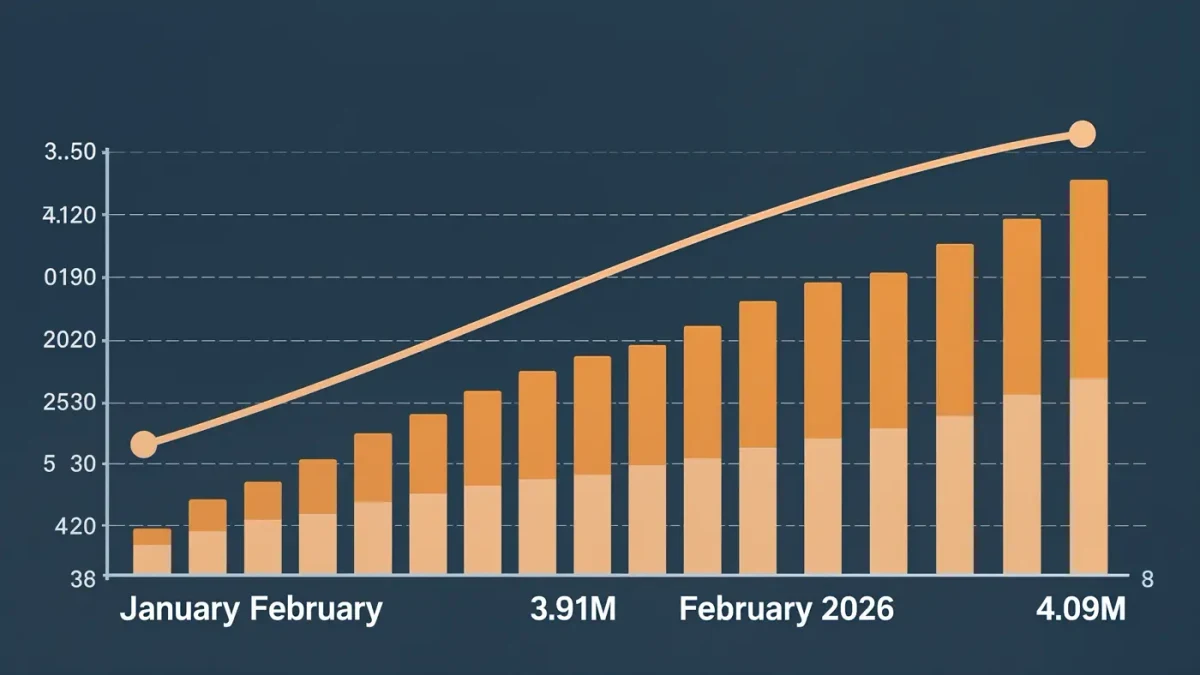
U.S. home prices rose 0.7 percent year over year in February 2026, down from a 0.8 percent annual gain in January, per the S&P Cotality Case-Shiller U.S. National Home Price Index release published in April 2026. It was the second straight month of deceleration and one of the weakest national readings in years.
The Case-Shiller national index tracks repeat sales of the same single-family homes over time, which makes it a lagging but clean measure of what owned housing actually transacted at — two months behind, with February data reported in late April.
What is different about this release?
February 2026 marked the first reports under the S&P Cotality Case-Shiller name, after the data provider formerly known as CoreLogic rebranded as Cotality, per the index announcements. The methodology is unchanged; only the branding moved. Subscribers of the release habit aside, the number to quote is still the National NSA index, which is the series quoted above.
Why does near-zero price growth matter for rentals?
Price growth near zero while rents keep rising compresses the price-to-rent ratio — the purchase price divided by annual rent — which is the starting point of yield math for income-property buyers. When prices stall and rents do not, gross yields on new purchases improve without any operational change. The reverse held through 2021 and 2022, when double-digit price growth outran rents and pushed yields down for everyone buying at the time.
What does 0.7 percent actually say about any single market?
Little, by design. The national index aggregates 20-plus metro composites, and annual gains in previous releases ranged from slight declines in slow metros to stronger increases in the Sun Belt and Northeast — city-level dispersion that a 0.7 percent national average hides. A buyer underwriting a specific rental property should price the deal off local comparables and local rent evidence, with the national index used only as cycle context: growth has cooled for months, and mortgage rates in the mid-6 percent range through early 2026, per Freddie Mac's weekly survey, kept payment-constrained demand in check.
Where does the index stop?
Case-Shiller measures owned-house prices on repeat sales. It says nothing about rents, nothing about new-construction pricing, and nothing about condominium or small-multifamily values tracked by other series. It is also revised, and February's print is an initial estimate. The data covers transactions through February; it says nothing about the spring selling season now underway.
For rental investors, the takeaway is a narrow one: as of the April 2026 release, the national price trend was flat enough that underwriting discipline, not appreciation, would carry returns on new purchases — the exact condition income-property buyers spent 2021-2023 wishing for.